

Most businesses spend far more on attracting visitors than on converting the ones they already have. Conversion rate optimization flips that balance by systematically finding where people drop out of your funnel, understanding why, and testing changes that help more of them take the next step. This article sets out a repeatable framework you can apply whether you run an e-commerce store, a B2B lead generation site or a property enquiry funnel.
Key takeaways
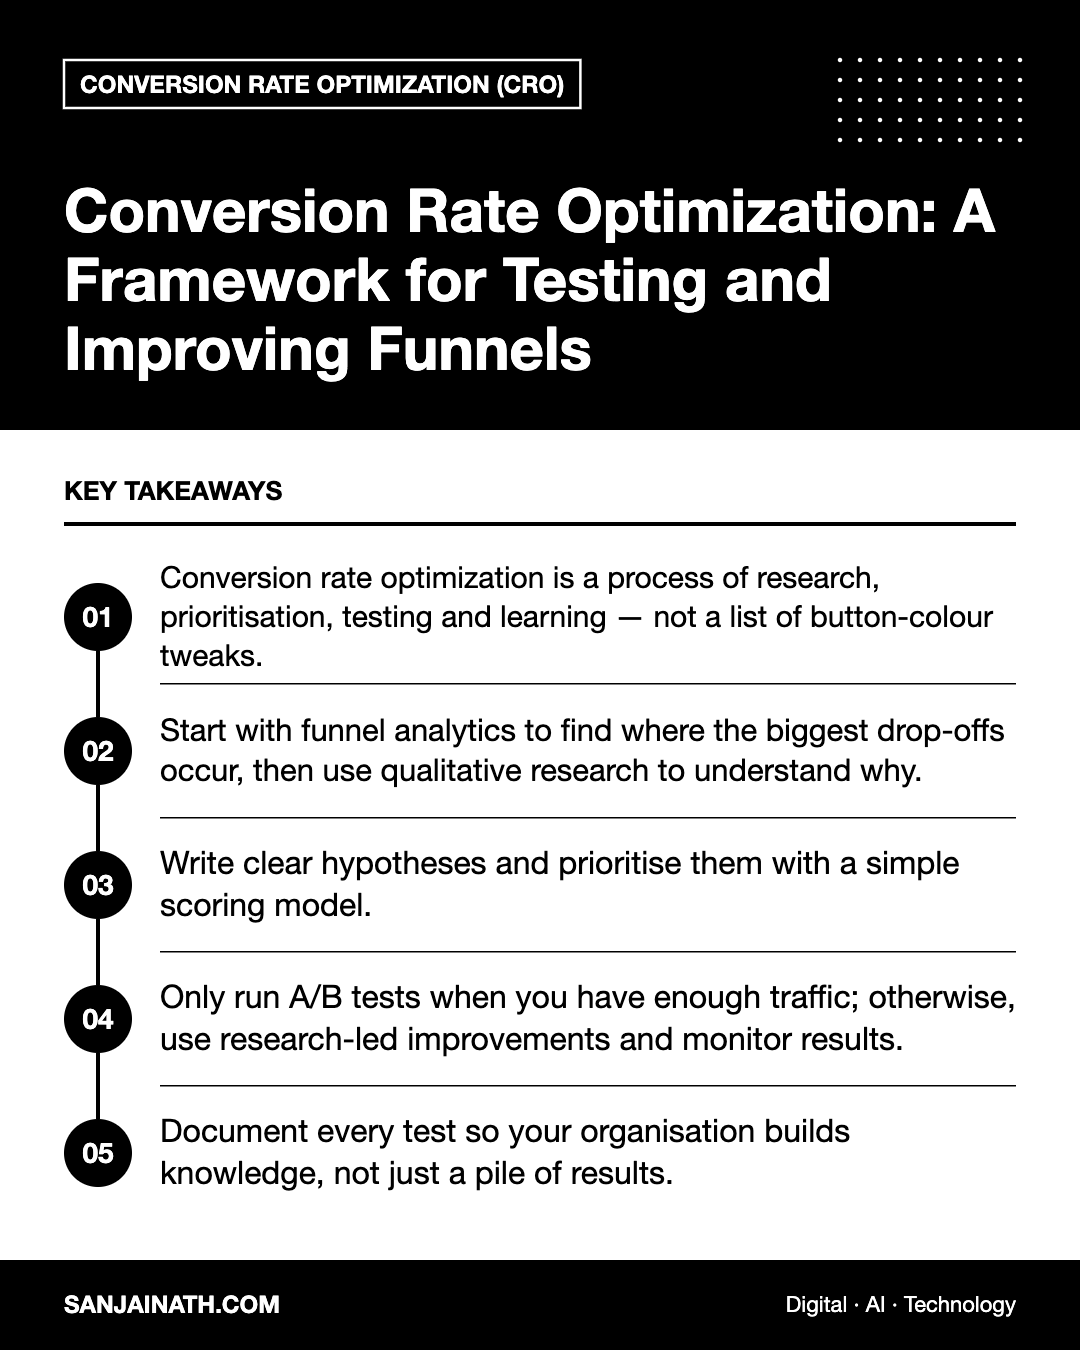
- Conversion rate optimization is a process of research, prioritisation, testing and learning — not a list of button-colour tweaks.
- Start with funnel analytics to find where the biggest drop-offs occur, then use qualitative research to understand why.
- Write clear hypotheses and prioritise them with a simple scoring model.
- Only run A/B tests when you have enough traffic; otherwise, use research-led improvements and monitor results.
- Document every test so your organisation builds knowledge, not just a pile of results.
What conversion rate optimization really means
A conversion is any action that moves a visitor closer to becoming a customer: a purchase, a demo request, a brochure download, a WhatsApp enquiry or an account sign-up. Your conversion rate is the share of visitors (or sessions) who complete that action.
Good CRO looks beyond the final conversion. A funnel is a sequence of micro-conversions — landing, engaging with a product page, adding to basket, starting checkout, entering details, paying. Improving any step improves the whole. It also looks beyond the rate itself: a change that increases sign-ups but attracts poor-quality leads is not a win. Always pair your conversion metric with a quality or revenue metric.
Step 1: Map and measure your funnel
You cannot optimise what you cannot see. Begin by defining the key steps of each important journey and making sure your analytics tracks them accurately.
- Define the journeys. For a retailer: product page, basket, checkout, purchase. For a B2B firm: landing page, pricing page, form start, form submit, qualified lead.
- Audit tracking. Confirm each step fires once, with the right parameters, across devices and browsers.
- Build funnel reports in your analytics tool, segmented by device, traffic source, new versus returning users and key markets.
- Identify the leaks. Look for the steps with the largest absolute drop-off, and for segments that perform noticeably worse than others — mobile checkout is a frequent culprit.
Step 2: Understand why people drop off
Numbers show where the problem is; qualitative research shows why. Combine several methods to avoid relying on guesswork.
Research methods that work
- Session recordings and heatmaps: watch how people scroll, hesitate, rage-click or miss key information.
- On-site surveys: ask a single open question at the point of friction, such as “What is stopping you from booking today?”
- Customer interviews: speak to recent buyers and people who chose a competitor to learn what nearly stopped them.
- Usability testing: give five or so representative users a task and observe where they struggle.
- Sales and support insight: frontline teams hear objections every day. Review chat logs, call notes and frequently asked questions.
- Heuristic review: have experienced reviewers assess pages for clarity, relevance, trust, friction and distraction.
Group your findings into themes — for example, unclear delivery costs, lack of trust signals, a confusing form or slow mobile performance.
Step 3: Turn insights into hypotheses
A strong hypothesis links an observation to a change and an expected outcome. A useful template is:
Because we observed [evidence], we believe that [change] for [audience] will result in [outcome]. We will know this when [metric] changes.
For example: because survey responses show visitors are unsure about delivery times, we believe that displaying estimated delivery dates on product pages for mobile shoppers will increase add-to-basket rate. We will know this when add-to-basket rate rises without a fall in average order value.
Step 4: Prioritise ruthlessly
You will generate more ideas than you can test. A simple scoring framework keeps decisions objective. Popular options include ICE (Impact, Confidence, Ease) and PIE (Potential, Importance, Ease).
| Criterion | Question to ask | Score |
|---|---|---|
| Impact | How much could this move the key metric if it works? | 1–10 |
| Confidence | How strong is the evidence behind the idea? | 1–10 |
| Ease | How quickly and cheaply can we build and test it? | 1–10 |
Favour ideas on high-traffic, high-value pages, backed by more than one research source. Ideas that are obvious fixes — a broken form field, a missing price — should simply be fixed rather than tested.
Step 5: Test properly
A/B testing compares a control against one or more variants with traffic split randomly. It is the most reliable way to attribute a change in behaviour to a change on the page, but only when done correctly.
Testing rules of thumb
- Calculate sample size before you start using a sample size calculator, based on your baseline conversion rate and the smallest effect worth detecting.
- Run tests for full business cycles — usually at least one or two complete weeks — to account for weekday and weekend behaviour.
- Do not stop early because a result looks exciting after a few days; early peeking produces false positives.
- Choose one primary metric in advance and track guardrail metrics such as revenue per visitor or lead quality.
- Check for technical issues such as flicker, broken layouts on certain devices or tracking gaps.
When you do not have enough traffic
Many B2B and niche sites cannot reach statistical significance in a reasonable time. In that case, test bigger changes, test higher up the funnel where volumes are greater, or implement research-backed improvements and compare performance over time while watching for seasonal effects. Usability testing becomes even more valuable here.
Step 6: Learn, document and iterate
Every test — winner, loser or inconclusive — should teach you something about your customers. Keep a test log recording the hypothesis, screenshots, audience, duration, results and interpretation. Over time, this becomes a knowledge base that prevents repeating failed ideas and helps new team members understand what your audience values.
Share learnings beyond the web team. If testing shows that customers respond strongly to payment flexibility or local delivery guarantees, that insight belongs in sales scripts, advertising and product decisions too.
Common conversion rate optimization mistakes
- Copying “best practices” from other sites without evidence they suit your audience.
- Testing trivial changes on low-traffic pages.
- Declaring winners on too little data.
- Optimising for clicks or sign-ups while ignoring revenue and lead quality.
- Neglecting page speed and mobile usability, which affect every other test.
Frequently asked questions
What is a good conversion rate?
It varies widely by industry, traffic source, price point and what you count as a conversion. The most useful benchmark is your own historical performance, segmented by channel and device.
How long should an A/B test run?
Long enough to reach your pre-calculated sample size and cover at least one full business cycle, typically a minimum of one to two weeks.
Which tools do I need for conversion rate optimization?
At minimum: a web analytics platform, a behaviour analytics tool for heatmaps and recordings, a survey tool, and an experimentation platform if your traffic supports testing.
Is CRO only for e-commerce?
No. Lead generation, SaaS, real estate, education and service businesses all have funnels that benefit from the same research-and-test approach.
Final thoughts
Conversion rate optimization rewards discipline more than clever ideas. Measure the funnel, understand real customer friction, prioritise with evidence and test with patience. Run that loop consistently and you will improve not only your conversion rate, but your understanding of the people you are trying to serve.